Showing posts with label python. Show all posts

Wednesday, January 29, 2014

PyBox Relaunch

A much too long time has passed since I blogged the last time. I guess the main reason for this is that I've been pretty busy with #DAYJOB for the last half year and while I did several things I considered blog-worthy, I just didn't put in the extra effort to go for an appropriate write-up.

This is not going to be a late new year resolution but I sincerely want to be more active again in terms of releases. I'll be likely going for smaller, incremental posts (like I did during the main IDAscope development) as these are easier to bring to an acceptable level of quality. If there is interest, I might also start covering more concrete malware analysis content but I have been reluctant towards this so far.

Today marks a milestone for an old project of mine. I have migrated the repository of PyBox from googlecode to bitbucket since googlecode has been more or less killed by disabling new downloads earlier this month (Git > SVN anyway).
I wanted to do the migration for half a year, but now I finally had the time needed to accompany it with a little story of what PyBox is and how we got there. In the same run, I compiled the DLL and pydasm for the two most recent versions of Python 2.7.
I hope that there is the one or the other interesting aspect in the code that might find usage elsewhere. Maybe PyBox by itself is interesting enough to know about as well. ;)

History of PyBox

Back in 2010 when Felix Leder was still at University of Bonn, he thought it would be great to have a highly customizable analysis framework / sandboxing tool for daily malware analysis. I guess he was inspired by the outcome of the Project Honeynet Google summer of code (GSOC) project Cuckoo sandbox for which he was an advisor at that time. :)
The idea behind Cuckoo has always been to inject a DLL into a target process and have that DLL serve as a platform for monitoring. In Cuckoo, the DLL is setting up a number of hooks for interesting Windows API functions. Later during execution, when hooks are triggered, the logging results in a sequence of calls to their target functions including the respective parameters.
PyBox is based on the same idea. As with Cuckoo, a DLL is injected into a target process to serve as a platform. However, upon injection, the PyBox DLL starts a fully fledged Python interpreter within the target process, allowing the execution of arbitrary Python scripts within the context of that process. Since Python is a great language for rapid prototying, this approach allowed us to quickly design analysis modules, e.g. custom sandboxes, tailored to certain aspects of chosen malware families.
Lately I've noticed that a similar concept is being realized by Frida, but using Javascript instead of Python.

PyBox architecture

In the following, I'll explain the architecture of PyBox when being used as a sandbox, its original intended use case.

Injection

As mentioned earlier, the core of PyBox is being injected as a DLL (./DLL/PyBox.cpp) into a target process, so we first need an injector. It is located at ./src/injector.py and the approach realized here is pretty straightforward. If the target process does not exist yet, start it (optionally suspended). For injection, first get a handle to the process (kernel32!OpenProcess), allocate some memory in it (kernel32!VirtualAllocEx) to store a string holding the path to our PyBox DLL (kernel32!WriteProcessMemory). Finally, use our good old friend kernel32!CreateRemoteThread to start a thread within the target process with kernel32!LoadLibraryA and the PyBox DLL path as argument.
For some side tasks, we use the module ProcessRigger (./src/process_rigger.py). For example, in order to easily perform follow-up tasks, it's nice to grant our injector and the target process the privilege SE_DEBUG. A more interesting functionality implemented in ProcessRigger is its ability to execute an arbitrary API call in the context of the target remote process. For this, we dynamically generate and write a short shellcode to the target process, consisting of the expected number of push instructions as arguments (either immediates or pointer to strings / structures) and the desired call to the target API as well as a consecutive call to kernel32!ExitThread. Nothing new, but useful.
For PyBox, we only use this to set some environment variables in the context of the target process in which PyBox is injected, but since I think the concept has potential for more, here is sample code and a diagram:


PyBox DLL

When the DllMain() of PyBox is loaded in the target process, it will first check the presence of said environment variables, proceed to open a file for logging and then initialize the Python interpreter. The PyBox DLL additionally makes itself available to the interpreter environment as an embedded module, enabling easy access to some native system functionality, like access to the process environment block (PEB), enumeration of exports for other DLLs, hook/callback handling and emergency termination. Finally, the PyBox DLL will hand over control to the target "box" starter script (example: ./src/starter.py) which then executes the desired analysis functionality.

PyBox API

As just mentioned, PyBox is intended to be used with independent "boxes" that are specialized for certain purposes. These boxes are powered by the functionality provided through the PyBox API.
First, there is MemoryManager (./src/pybox/memorymanager.py), granting access to memory manipulation functions in the process address space via Python ctypes. A bunch of convenience functions automatically handles read/write permissions of given memory to enable read/write operations.
Next, there is the ModuleManager (./src/pybox/emodules.py), which enumerates all other loaded DLL files (= executable modules) in the target process' address space in preparation of hooking. The enumeration is done through the embedded module provided through the PyBox DLL itself, in order to speed up this procedure.
The PyHookManager (./src/pybox/hooking.py) provides an interface to PyBox' hooking functionality: add and remove hooks, check if an address is already hooked (similar addresses can be hooked with multiple hooks, which are then executed in chain), and selecting the appropriate hook through its function find_and_execute(). The reason for this last function is that all hooks are first pointing to the same callback address in the PyBox DLL which handles mutual exclusion (as well as the Global Interpreter Lock (GIL) of Python) prior to transferring control to the hook code implemented in Python.
There exist three classes of hooks: PyFunctionEntryHook, PyReturnAddressHook, and PyHookClone. When a new PyFunctionEntryHook is created for a target address (e.g. an Windows API function), up to 20 bytes of memory are read and disassembled via pydasm. The reason for this is that we need to overwrite 5 bytes for a jmp instruction to our hook trampoline (PyTrampoline) while preserving the integrity of the modified code. If more than 5 bytes are taken, the rest is padded with NOPs { 90 }. For most Windows API functions, we run into no trouble as they usually start with "move edi, edi; push ebp; mov ebp, esp" which sums up to exactly 5 bytes but this may not the case for arbitrary other functions. A PyReturnAddressHook is realized by overwriting the original return address of a function with a PyTrampoline address. A PyHookClone is used when hooking one address with multiple hooks and references the original first hook.
The PyTrampoline is a dynamically generated shellcode, preparing the call of a hooking function. It is optionally prefixed with a "jmp self" { EB FE }, which turns out useful when writing a box for unpacking. It can be used with the intention to intercept the control flow before OEP is reached (in order to attach a debugger and proceed manually). Next the current register state is saved (PUSHAD { 60 }) and an identifier for our hook is pushed (this allows to differ multiple hooks on the same address). Hooks can optionally be used with their own parameters, so these are pushed { 68 11223344 } now. Finally, a call to the hook function is made { E8 ca11bacc }. When the hook returns, the register state is restored { 61 } and any original opcode bytes saved during overwriting the target address when setting up the hook are executed. Finally we jump back to the instruction behind the originally hooked address { E9 001dc0de }.
In summary, hook execution looks like this:
When a hook is called, it can access and modify the current function execution context (return addr, stack) and register context (from EAX to EDI) through two respective objects passed to it as argument.
Besides these modules, there is also an unfinished dumper module and a ProcTrack module, which hooks API functions for spawning new processes and injects the current box into these when triggered.

Box Scripts

I have included two sample boxes in the version pushed to the repository.

The first example is the standard sandbox (stdbox), which hooks a range of interesting API functions one would be interesting in when tracing the execution of malware. I have gone for a harmless example and traced the creation of a new file on disk through notepad.exe (uploaded here).
Most of the lines in the log file are noise, important are these:

2014-01-29 12:05:59,878 - INFO - kernel32.dll.CreateFileW(\
C:\Documents and Settings\redacted\Desktop\test.txt, 0x80000000, 3, 0, 3, 0x00000080,0
[...]
2014-01-29 12:05:59,898 - INFO - kernel32.dll.CreateFileW(\

C:\Documents and Settings\redacted\Desktop\test.txt, 0xc0000000, 3, 0, 4, 0x00000080,0)
2014-01-29 12:05:59,898 - INFO - kernel32.dll.WriteFile(\

0x00000138, 0x000e0db8, 0x0000000c, 0x0007faf0, 0x00000000)

As you can see filename is "test.txt" on the desktop. The first call to CreateFileW() with GENERIC_READ access and CREATE_ALWAYS+CREATE_NEW flags create the file. The second call with GENERIC_READ+GENERIC_WRITE access and OPEN_ALWAYS flags opens the file for writing. This is ultimately followed by WriteFile() putting the bytes "just a test" in there.

The second example is the more useful RWX box. This box will only log calls that being made from RWX memory. The idea behind this would be e.g. PyBox injection into explorer.exe in order to monitor the behaviour of malware self-injecting into that process. Once again here is an example, this time of Citadel injecting into explorer.exe.
  • In lines 8-813 you can observe Citadel creating its dynamic import table within the context of explorer.exe.
  • In lines 817-1137, Citadel creating hooks itself for a range of Windows API functions.
  • In lines 1138-1271 you can see Citadel starting some threads and guess about their intention (ObtainUserAgentString -> mimic target system's browser, WABOpen -> crawl address book for email addresses).
  • From line 1272 on, you can observe Citadel searching for other processes to inject into.
  • Finally, from line 1372 on, Citadel found a target and injects itself.

I have included a startup batch file for both boxes so you can easily try them out.
These boxes are rather generic and simple, but it should be easy to imagine that more powerful use cases for automation can be covered (conditional controlling and patching of "interesting" memory).
More advanced stuff was shown by Felix in his talk at Troopers conference in 2011, e.g. how to intercept network payloads before they enter an SSL connection (FireFox) or how to analyze obfuscated PDF exploits by pyboxing Acrobat.

Conclusion

So that's my short intro to the PyBox framework. Notice that it only works up to WinXP since we are practicting evil process/memory voodoo here and there that does not like modern memory protection mechanisms.
Currently, there is also no intention to further pursue development of this framework unless there will be unexpectedly huge interest in this. ;)
Hopefully some of the design or implementation details may be of interest to some of you so the PyBox spirit can live on!

Saturday, January 5, 2013

IDAscope progress

Originally, I only wanted to give a short update on the stuff I did to IDAscope at the very end of the 29c3 post... Apparently I created enough content to let this be a post of its own. 
So now I want to cover up the recent activities around IDAscope from the last month or so. I'm currently working on graphing stuff, as some of you might have seen on Twitter already but I will cover this in an extra post and full detail when it has reached a presentable (release-worthy, that is) state.

Late November I had some free time to push IDAscope a bit forward. As can be seen from the commit history, most changes were bugfixes, covering:

  • Update to renaming wrappers (thanks Branko).
  • A small bugfix for xrange() beyond 0xFFFFFFFF.
  • The usage of the results generated by Tarjan's algorithm for finding strongly connected components was implemented incorrectly and would not cover basic blocks in nested or non-trivial loops.
  • The Counting of semantic API hits in FunctionInspection was incorrect under certain circumstances.
  • IDAscope can now properly used as an IDA plugin. It can be dropped into the plugins folder, allows autostarting with the loading of a new binary and can be started via IDA's Menu.
  • Config file format was changed from JSON to Python for easier parsing and the ability to comment entries within the file.
  • Semantic tags can now be grouped within the definitions file.
  • Entries in FunctionInspection widget can now be shown as groups and filtered customly.
Filtering looks like this:


Probably more interesting is the visual feature I am working on.

Graphing Function Relationship

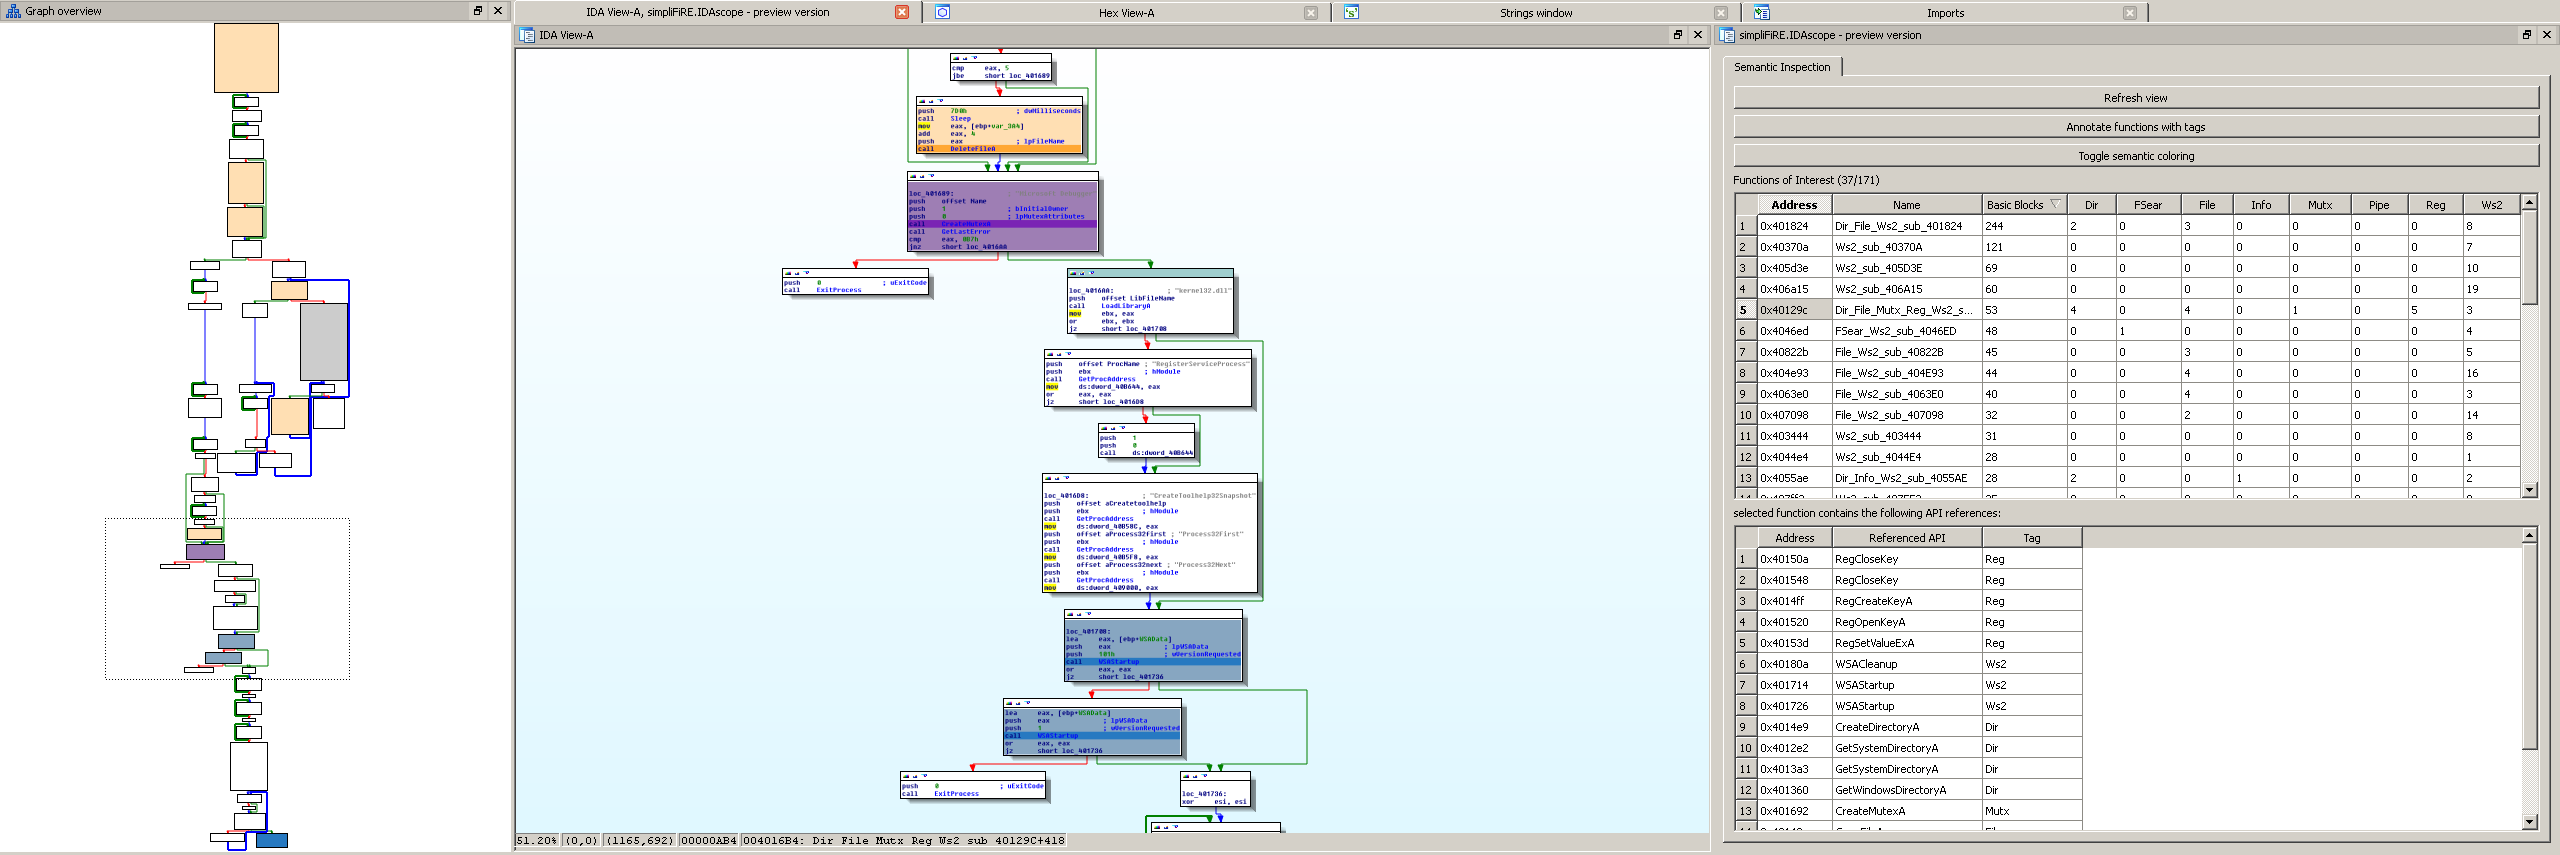
My current progress on graphing includes being able to extract the structure of arbitrary functions and their referenced children from IDA and generating a graph layout based on this information. However, nodes can still be moved freely around once the calculated layout has been "unlocked". Incoming and outgoing references are coloured green/red to improve the navigation. API calls are not shown but shall be nested within the display of their respective calling function (red box to expand and show these API calls). The graph can be dragged around, navigated with keyboard and seamlessly zoomed in and out.
At the moment, it looks like this:


Before I actually fill this with more functionality such as actions upon clicks (move to function, rename function, displaying API calls within function, optional colouring, you name it, ...) I have to solve other, more essential issues. :)

When displaying graphs of functions with a lot of children, I run into the same issues as you all experienced with the WinGraph overviews:

 
You don't really get the structure any longer and everything becomes unreadable. However, having this window open besides your one function view already is a benefit, I guess. Furthermore, removing API calls from the set of nodes being graphed improved the situation a bit as well but I am not satisfied yet.

A property of these large graphs is that their aspect ratio is massively out of order, they are much wider than high. This can likely be fixed by patching the graph layout algorithm I am currently using. Again, thanks to bdcht for providing his lib grandalf!

While relationship between functions is probably easier to grasp in my graphs already...


... I want to work towards something that is really helpful for browsing functions and recognizing patterns among their relationship.

Right now it's too "alpha" to show around some code already but please contact me if you have ideas you want to see embedded into this or see potential for improvement!

We'll see where I end up with this.
Make sure to check out the repository from time to time to keep up with the additions and improvements. Larger releases are announced here in the blog, shorter ones on Twitter.

Sunday, November 18, 2012

TDD & IDAPython

This is just a short note in which I want to share my experiences with writing test code for (IDAPython) scripts I use and produce on a daily basis.

The case for Test-Driven Development

A while ago, I thought it would be a good idea to advance my coding skills. So I had a look around methodologies that are popular in software development but that I had not tried myself.
The best candidate seemed to me Test-Driven Development (TDD) as I was familiar with the concept of unit testing but I was not able to believe that TDD can drive architecture and design decisions.

I started reading the Clean Code series of books by Uncle Bob. The books start out with general advice on how to structure your code in a way it is easier to understand and maintain. I recognize these books as an efficient way to lift your own coding habits to an acceptable level if you plan on publishing code.
In the later chapters the book focusses on TDD. I transferred the given example projects to Python (instead of Java, which the book uses) and really tried hard to embrace TDD as driving method for code generation.

- Well, didn't work out so far for me. ;)
Personally, I still have the impression TDD slows me down too hard when initially implementing functionality. That's because there is only a very limited time frame when doing analyses and helper scripts are mostly tailored to specific use cases and often not part of the analysis result. So the code has limited value to me.
Additionally, refactoring and restructuring can probably become more painful as you obviously have to change both production and testing code. But this is a wrong assumption as I will later point out.
However, I understand the argument that finding & fixing bugs is more expensive in regards of time than preventing to having bugs in first place. But as my projects (helper scripts) usually have a few hundred lines at most and many are even one-shot tools, the overhead does not fit. For large projects, I would definitely give TDD a shot.

Nevertheless, over trying TDD, I really started liking to have tests for my code for the following reasons:
  • Tests give me increasing confidence instead of the feeling that I'm piling up a house of cards that may collapse with additions.
  • Writing tests to fix bugs both documents the bugs and offers valuable insights in my shortcomings when writing the code in first place. Helps to avoid the same errors in the future.
  • My code itself has become much more modular as I'm looking out to have it testable. Refactorings actually have become easier.
  • Tests come in as a free documentation on how to actually use the code, both a help for myself (looking my code again after some months) as well as for others.
  • I only have to write tests for parts of the code I think that are worth being covered by tests ("complex"), indicated by me having had to think about them for some time before simply pinning them down.
  • Executing successful tests is quite satisfying.
So I regularly produce "test-covered" code now, instead of "test-driven" code which I'm pretty happy with. Should have done that with IDAscope as well but I'll add tests for all future bugs I find, I guess.

Tests in IDAPython

So how to use this now in IDA? Here is my template file for writing tests:

import sys
import unittest
import datetime
from test import *

import idautils

class IDAPythonTests(unittest.TestCase):

    def setUp(self):
        pass

    def test_fileLoaded(self):
        assert idautils.GetInputFileMD5() is not None


def main(argv):
    print "#" * 10 + " NEW TEST RUN ## " \
        + datetime.datetime.utcnow().strftime("%A, %d. %B %Y %I:%M:%S") \
        + " " + "##"
    unittest.main()


if __name__ == "__main__":
    sys.exit(main(sys.argv))

In this template we have only one test in our test case "IDAPythonTests" called "test_fileLoaded". Tests to be executed by the Python unittest testrunner use the prefix "test_".
Normally you would not test directly against IDAPython's API as in this example but would rather test your own code through function calls, with your code usually being located in a different file and imported into the test case.

You can run this as a script within IDA while having loaded a file for analysis. This allows you to specifically test your code against IDAPython's API on the one hand and using the contents of the file under analysis for verification on the other hand.
The output of the above script while having loaded a file and not having loaded a file to demonstrate the test's behaviour looks like this:

---------------------------------------------------------------------------------
Python 2.7.2 (default, Jun 12 2011, 15:08:59) [MSC v.1500 32 bit (Intel)] 
IDAPython v1.5.5 final (c) The IDAPython Team <idapython@googlegroups.com>
---------------------------------------------------------------------------------
########## NEW TEST RUN ## Sunday, 18. November 2012 11:49:29 ##
.
----------------------------------------------------------------------
Ran 1 test in 0.010s

OK
########## NEW TEST RUN ## Sunday, 18. November 2012 11:50:06 ##
F
======================================================================
FAIL: test_fileLoaded (__main__.IDAPython_Tests)
----------------------------------------------------------------------
Traceback (most recent call last):
  File "Z:/ida_tests.py", line 14, in test_fileLoaded
    assert idautils.GetInputFileMD5() is not None
AssertionError

----------------------------------------------------------------------
Ran 1 test in 0.000s

FAILED (failures=1)

Pretty much the IDAPython shell we are used to + the nice output from Python's unit testing framework.

Thursday, November 1, 2012

PKCS detection

While I already announced in my last blog post that the PKCS detection feature was implemented in my private development branch of IDAscope, I just wanted to do another technical write-up in order to cover it up properly.

I think starting from now on, I'm going to write more about the actual development process and code produced in order to share some insights in how to use IDA's Python API.

Feature-wise, this is not a big deal but I thought it would be fun to have this integrated.

How it began...

So this story began last week at hack.lu where mortis talked to me about IDAscope. He then said that some time ago he used some older tools in order to detect/extract PKCS components from a binary and I told him that it would be actually a nice idea to have this in IDAscope as well as there is malware with signed updates using asymmetric cryptography.

He pointed me to this 2010' script by kyprizel, which was a good starting point.It's based on a tool by Tobias Klein, which sadly he makes no longer available due to German law (so called "anti hacking" paragraph §202c).

I looked at kyprizel's script and thought that something like this should be doable in a short amount of time. I changed IDAscope's code quickly but then I remembered that you often find base64 encoded certificate and key data.

I got motivated by that and wanted to cover it as well. On the other hand, I realized that implementing this feature, in kyprizel's way, I would open IDAscope to scanning of arbitrary wildcard signatures, which I saw as a big chance. So here we go.

PKCS detection

As written before, the goal of this feature (and blog post) is detecting data fragments that might be involved in asymmetric crypto schemes such as public/private keys and certificate data. You might now it e.g. when using keys instead of passwords for SSH login.

Here is a random private key (PEM format), easily generated on the shell with:
pnx@box:~/tmp/keys$ openssl genrsa -out privkey1024.pem 1024
resulting in:
-----BEGIN RSA PRIVATE KEY-----
MIICXAIBAAKBgQDYOt0RgdoIqgu1ncHeMkqeJNc6xFKfM9UOOl97fXLDtot5fped
/ELrR8GTcWKK1qotw3alZUfMs0q4t8vd7f4FbZUSv+Psg1tIyiXXbvnrbk5TTg+X
J0FqLkz7U8OxyMjR+HygML3/3Pq6oYZGkrLF0XkqHmQWq9EF0oF9BRbo4QIDAQAB
AoGATSRq/DT8aXzpIok+whvlHRh9pNynsV6XkzTmHbN6vzIf/l9YjieSZEg8WnLo
OiotmpgSex1wCSqp7M69r9aZegPcHIAN5c82/mItXiz4A07CBoxbpWc6pItUZ6eO
4RrFF3k0jn5edtFOlvaUaKtiQTo/rrFOKPj6hJAxlPNlehUCQQD+9PutMUznQ0O9
6k/mmH6EYRhAQSzDmfN3m9it3Txzd3mAyTIykLlf1HBVs1WdIKfWT167FJZlgoWF
TJWwFzjfAkEA2R1SUQxdDJYt3/13XkS2x1W/P6qMkAqIhy88YPWHJrdmLCyHkhlg
/PQYxZABxLHq3Yk886SHR8/vXzz4tVtWPwJAcH+9BeD5JBqEK6rWctPbD6KgRsn7
bJvj2GVGKQG0COcxD+i3Y6SEh4p/vvEQ1/Ju3JvNGxOsgUIklHsEmdzFVQJBAMAK
+JHqHrAQcrmK6LgAjbAZ/5WgFL8gIg15Ua3t38L2PDDcnnozap+0hejSbU3/leCp
ELnuER8LJQ+XzeIUzV8CQC8zvwYwGnYx2p3wK1iIDuhLki5tKS3CuZf869tKoNmD
DVoeWjSDK1MDcrtqsslhMOo1yt7ajocTXGhV0nmcNk0=
-----END RSA PRIVATE KEY-----

and the according public key (PEM format), obtained via openssl, once again:
pnx@box:~/tmp/keys$ openssl rsa -in privkey1024.pem -pubout -out pubkey1024.pem
producing:
-----BEGIN PUBLIC KEY-----
MIGfMA0GCSqGSIb3DQEBAQUAA4GNADCBiQKBgQDYOt0RgdoIqgu1ncHeMkqeJNc6
xFKfM9UOOl97fXLDtot5fped/ELrR8GTcWKK1qotw3alZUfMs0q4t8vd7f4FbZUS
v+Psg1tIyiXXbvnrbk5TTg+XJ0FqLkz7U8OxyMjR+HygML3/3Pq6oYZGkrLF0Xkq
HmQWq9EF0oF9BRbo4QIDAQAB
-----END PUBLIC KEY-----

One thing that might get one's attention is that both keys' base64 representations shown here start with "MI". The reason for this is that both keys are not encrypted and this way provide a hint to the underlying data structures, in this case Distinguished Encoding Rules (DER), specified in X.690. That's the point where we can now dive into PKCS standards. :)

First off, I won't go into details but focus on the things needed to implement a working detection of these data structures. For more information, there is a good Phrack article from 1998 by Yggdrasil on PKCS #7.

Distinguished Encoding Rules (DER)

DER features a type system that can be used to encode elements of which keys and certificates consist. RFC 3447 tells us how to use these elements to specify above private and public keys. I'll continue with the public key because it's shorter and suffices for the example.

First, here is a hexdump of the base64-decoded public key above:
0000000: 3081 9f30 0d06 092a 8648 86f7 0d01 0101  0..0...*.H......
0000010: 0500 0381 8d00 3081 8902 8181 00d8 3add  ......0.......:.
0000020: 1181 da08 aa0b b59d c1de 324a 9e24 d73a  ..........2J.$.:
0000030: c452 9f33 d50e 3a5f 7b7d 72c3 b68b 797e  .R.3..:_{}r...y~
0000040: 979d fc42 eb47 c193 7162 8ad6 aa2d c376  ...B.G..qb...-.v
0000050: a565 47cc b34a b8b7 cbdd edfe 056d 9512  .eG..J.......m..
0000060: bfe3 ec83 5b48 ca25 d76e f9eb 6e4e 534e  ....[H.%.n..nNSN
0000070: 0f97 2741 6a2e 4cfb 53c3 b1c8 c8d1 f87c  ..'Aj.L.S......|
0000080: a030 bdff dcfa baa1 8646 92b2 c5d1 792a  .0.......F....y*
0000090: 1e64 16ab d105 d281 7d05 16e8 e102 0301  .d......}.......
00000a0: 0001                                     ..

According to the RFC, an RSAPublicKey is a SEQUENCE of two INTEGERS (ASN.1 notation):
RSAPublicKey ::= SEQUENCE {
          modulus           INTEGER,  -- n
          publicExponent    INTEGER   -- e
      }

Looking at DER specifications we see that elements are usually specified as tag-length-value (TLV) tuples. A SEQUENCE is such an element and starting off with a fixed tag-byte of 0x30, which meets the 1st byte of the above hexdump.
The 2nd byte is the length byte. DER length bytes have a special encoding depending on the length they shall express. If the target length is less than 128 bytes (and thus expressible in 7bits), the byte itself specifies the length. This covers bytes 0x00 - 0x7f.

If the length is equal or above 128 bytes, bit 7 is set (thus setting the length byte to 0x80 or above) and bits 0-6 specify the number of bytes immediately following the length byte and indicating the actual length.
In the above hexdump, we can see that the length byte is 0x81. First, this indicates that the length is bigger than 128 bytes. Second, this indicates that the length is covered in one additional byte. This byte is the third byte of the dump, 0x91, showing that there are 159 bytes in this SEQUENCE.

The third part of the tuple is the actual value of the SEQUENCE.

In this case it is beginning with another SEQUENCE (indicated by the 4th byte of the dump, 0x30) of length 0x0d (5th byte of the dump, 13 bytes) and value 06092a864886f70d0101010500.

The first byte of this inner SEQUENCE is a again a tag-bytes. 0x06 indicates an OBJECT IDENTIFIER. Its length is 0x09 (9 bytes) and the value is 0x2a864886f70d010101, which translates to 1.2.840.113549.1.1.1 (rsaEncryption, read this for more details on decoding). The remaining 2 bytes of the sequence 0x0500 are a NULL element, which again is a TLV with tag 0x05 and length 0x00, having no actual value.

Now that we have handled the first part of the sequence, we can look forth, starting with the 19th byte and a new element. This time, the tag-byte 0x03 indicates a BIT STRING of length 0x8d (141 bytes). The first value-byte in a BIT STRING signals how many bits in the BIT_STRING are unused, in our case 0x00 = zero bytes.

The BIT STRING encapsulates another SEQUENCE, as the 23rd byte (hexdump position 0x16, value 0x30) tells us. The length is indicated by the next two bytes and set to 0x89 (137 bytes).

The first element in this SEQUENCE is a new type that we haven't seen before, indicated by tag-byte 0x02. This is an INTEGER element of length 0x81 (129 bytes). Remembering what we learned from the RFC about RSAPublicKey, this is now finally our modulus n! But we generated a 1024 bit (=128 byte) key via OpenSSL before, so why is this INTEGER of length 129 bytes? The explanation is simple: The leading byte of the INTEGER simply indicates the sign, in our case 0x00, meaning it's a positive number.

The second element of the SEQUENCE is another INTEGER (beginning at hexdump position 0x9d, value 0x02) the publicExponent of length 0x03. Its value is 0x010001=65537, which is pretty standard for keys generated with OpenSSL.

That's basically the complete walkthrough of this DER-encoded public key, just to wrap up, we have:
SEQUENCE
  SEQUENCE
    OBJECT IDENTIFIER   <- rsaEncryption
    NULL
  BIT STRING
    SEQUENCE            <- RSAPublicKey
      INTEGER           <- modulus
      INTEGER           <- publicExponent

Deriving signatures

Okay, as we have seen, the binary DER format with its TLV elements gives us multiple points we can attack with a signature. Back to Python, I have decided to attack the inner part of SEQUENCE to INTEGER, coming to the following binary signature for a 1024bit public key:
{VariablePattern("30 81 ? 02 81 81"): "PKCS: Public-Key (1024 bit)"}
Just to explain, VariablePattern is a simple type derived from str, just to indicate to IDAscope that we have a variable pattern of hexbytes that may contain wildcards such as "?", feedable into the great
idaapi.find_binary(start_ea, end_ea, pattern, radix=16, direction=SEARCH_DOWN)
in order to search in our IDB. Radix is set to 16 because our pattern consists of  hexbytes and SEARCH_DOWN equals the value 1.

Signatures for other bit lengths of public keys look much the same, just with adjusted TLV length fields. Private keys simply have another INTEGER (being zero) in front of the modulus, indicating that it is a 2-prime key:
{VariablePattern("30 82 ? ? 02 01 00 02 81 81"): "PKCS: Private-Key (1024 bit)"}

Scanning

However, if we look back to where we came from, we had base64-encoded
structures and not the plain binary as shown in the hexdump.

Scanning for those binary keys is straightforward. But to make those Base64 encoded once also searchable in IDA we need some extra-effort.

I decided to temporarily map all potentially base64 encoded strings into the memory space of IDA, more precisely in a bonus segment.

We can get all strings allowing base64-decoding easily by looping over the names, checking if they are ascii and performing decoding via try and error:
def getDecodedBase64Strings(self):
        decoded_names = []
        for name in idautils.Names():
            flags = idaapi.GetFlags(name[0])
            if not idaapi.isASCII(flags):
                continue
            ascii = idc.GetString(name[0])
            try:
                decoded = ascii.decode("base64")
                decoded_names.append(decoded)
            except:
                continue
        return decoded_names


I decided to create a new Segment and put all decoded strings there:
# any currently unused space will do
start_ea = 0x1000
# we need enough space to fill in all our base64-decoded strings.
end_ea = 0x1000 + sum(map(len, decoded_names))
# new segment shall have paragraph alignment and public access
idc.AddSeg(start_ea, end_ea, 0, True, idc.SA_REL_PARA, idc.SC_PUB)
offset = start_ea
for name in decoded_names:
    for byte in name:
        idc.PatchByte(offset, ord(byte))
        offset += 1
The decoded strings are now directly searchable with find_binary() as described before.

In IDAscope I'm doing a bit more in order to extract the exact positions where the keys (base64 or not) sit in the binary.

Currently supported are the following PKCS structures:
  • unencrypted RSA public key 512bit - 8192bit
  • unencrypted RSA private key 512bit - 8192bit
  • X.509 Certificates

Test Case

What would be a blog post without a demonstration. I took a Kelihos / HLUX sample (MD5: 14ff8123f58df1ec4a49afe70c84723b) which has proven quite good for testing lately.
It has 5600+ functions (huge!) and features a lot of crypto signature hits:

Detection of two RSA 2048bit public keys in HLUX.
Among those hits are two base64-encoded public keys that have been detected by IDAscope. You can see that those also start with "MI" and if you have read the whole post, you can deduce at this points that this has to be related to the 0x3081/0x3081 (SEQUENCE) with which the binary data is starting.

Other IDAscope Changes

There have been a lot refactoring steps in the codebase that are not visible to the outside. I will likely go on with that, with the goal in mind to move towards a  point where you can use IDA+IDAscope without its GUI, basically by using an IDAscope API allowing for further automation purposes.

A minor change has happened to FunctionInspection with another button in the toolbar:
There are now two "fix code options" in Function Inspection
The "Fix unknown code to functions" option has been split up. There is now one button (plain plus sign) for only converting those undefined code regions that start with a valid function prologue and a second button (double plus sign) that will try to fix all code to functions.

Reason for the split-up is that converting all code can mess up the number of functions pretty bad while looking for function prologues produces only a very limited number of hits.

Next Steps

Right after telling Alex about the extended signature detection with wildcards, he asked me if YARA support in IDAscope could be an option. I'm still thinking about it but I definitely see the advantages as it would allow the easy reuse of existing signature databases. So this might come to the agenda.

Marco Ramilli blogged about IDAscope some days ago and suggested to build a more extended "behaviour analysis" upon the existing tagging feature. We had already experimented with this "static sandbox" idea before but the code is yet too experimental to find its way into the production branch. So this is also a potential feature for the future.

At hack.lu and in the slideset I showed an idea of improving the visualization of functional relationship. This is also something I want to work on in the near future as I believe that this would really aid the reversing workflow by providing more overview.

So stay tuned for the future development and as always, write us mails to
<idascope<at>pnx<dot>tf>
if you want to give us feedback or submit ideas for development.

Monday, September 17, 2012

IDAscope Release!

Good News for all people interested in IDAscope.
I submitted the extension to the Hex-Rays contest two days ago and today I want to follow up promises and release a first public version.

You can find the repository we will use to publish future updates here:

https://bitbucket.org/daniel_plohmann/simplifire.idascope/

There is a prepared download for version 1.0. You can also checkout via git from the repo (right now they have the same content).

For installation instructions, feature description and usage, check out the manual located in IDAscope/documentation/manual/.

A big THANK YOU to all people who did a beta test of IDAscope. You provided very helpful feedback!

We hope it turns out to be an useful addition to IDA Pro. Development does not stop here of course, as we plan to continue the project to integrate more features.

We are open to feedback, so don't hesitate to tell us your opinion!

UPDATE 18.09.2012: There was a bug in the initial release that has been fixed. Check out the following blog post for details and a new feature!

Saturday, September 1, 2012

IDAscope beta update

Nothing much to blog about. Therefore, only a short update on IDAscope's progress.
I just pushed out a second beta version to the people that expressed interest in testing it. If you are interested, too, this announcement is still valid. ;)

Here is a list of changes/fixes included with the second beta:

Function Inspection:
- Added functionality to create functions from unrecognized code. This function will first try to find and convert function prologues (push ebp; mov ebp, esp) and then convert the remaining undefined code.
- Added functionality to identify and rename potential wrappers (small functions with exactly one call referencing an API function). Thanks to Branko Spasojevic for this contribution.

WinAPI:
- Fixed path resolution for html files, should work on non-Windows operating systems now, too. Thanks to Sascha Rommelfangen for fixing this, I only have IDA versions on Windows available so I could hardly debug this.
- Included a back/forward button to allow easier browsing of visited articles.

Crypto Identification:
- Adjusted default parameters to a tighter set, resulting in less false positives on startup.
- Added some crypto signatures (CRC32 generator, TEA/XTEA/XXTEA).

The public release will be in two weeks from now.

Monday, August 20, 2012

IDAscope Beta


I've finished writing Epydoc-compatible documentation for the code and changed some more minor things. This basically summarizes my weekend. So here is just a short announcement for today.

Beta-Test


If you are interested in beta-testing IDAscope, please write an email to:

idascope <at> pnx <dot> tf

including the operating systems you run IDA on, the version of IDA you have and a short reason why you are interested in the plugin / what you usually use IDA for. E-Mail is required, so I can provide you a download link.

Note: IDAscope is completely Qt-based (requires PySide installed along IDA to run) and I could only test it with IDA 6.2 and 6.3 on x86 Windows so far. Therefore, I'm mostly interested in other setups.

I'll hurry in preparing a release package (with a short manual), you should get a notification in the next days.
Depending on the number of requests, I'll limit beta-testing to a group of users that covers a maximum of variety in system/IDA setups and versatility in IDA usage.

Don't be sad if you are not in that group because the official release of the first version will hopefully be following the beta quickly!

Wednesday, August 15, 2012

IDAscope update: Crypto Identification

After being quiet for almost three weeks, today I want to share with you my latest additions to IDAscope.

Focus of this post will be a new widget that I call Crypto Identification.
Now you may say "oh no, yet another crypto detection tool?" Well, yes, but before you stop reading let me introduce you to an approach you might find useful.

Heuristics-based crypto detection by code properties

About 2 years ago, during literature research on network protocol reverse engineering, I came across an interesting paper called "Dispatcher: Enabling Active Botnet Infiltration using Automatic Protocol Reverse-Engineering" by Juan Caballero et al. Besides the description of an approach on how to identify and dissect message buffers into protocol fields, it contains a section on automated detection of cryptographic routines ("Detecting Encoding Functions", p. 10).
The main idea is pretty straight forward:
  1. Evaluate the ratio of arithmetic/logic instructions related to all instructions in a function.
    Assumption: Cryptographic functions usually consist mainly of
    arithmetic/logic instructions, thus they should have a higher ratio.
  2. If the function has a size of 20 or more instructions, flag the function as encoding function.
While the approach described in the paper is applied to dynamically achieved instruction traces, there is no reason why not to employ it in static code analysis. So my goal for today is to show you how to make "academic things" practically usable. ;)

I use the following set of arithmetic/logic instructions, please tell me if I missed something:
  • ["add", "and", "or", "adc", "sbb", "and", "sub", "xor", "inc", "dec", "daa",
    "aaa", "das", "aas", "imul", "aam", "aad", "salc", "not", "neg", "test", "sar",
    "cdq"]
The following screenshot shows the widget in action:
IDAscope: Crypto Identification widget
The functionality I just described is located in the upper part of the widget. There are three double-sliders that can be used to adjust the following parameters:
  • Range of Arithmetic/Logic Rating: The above mentioned ratio of
    arithmetic/logic instruction to total instructions, but calculated on basic
    block level instead of function level.
  • Considered Basic Block Size: Only blocks having a size within the
    boundaries are taken into concern.
  • Allowed Calls in Function: Number of calls allowed from the function
    containing the analyzed basic block to any other code location. This is
    based on the assumption that most actual cryptographic/compression
    functions are "leafs" in the overall program flow graph, not having any
    child functions.
With these filter functions, we can greatly narrow down the number of suspicious basic blocks to those really containing interesting crypto or compression algorithms. Once the initial scanning has been performed (sample with 700 functions, less than one second), the sliders update the visualization in real-time. Qt only chokes when viewing all 9500 basic blocks at once, but that's not what you want anyway.

The two checkboxes give further ways to refine the search:
  • Exclude zeroing Instructions: This can be used to reduce false positives
    that may distort the rating. You will often find instructions like xor eax, eax
    or sbb eax, eax being used to clear register contents. However, they would
    normally be included in the calculation of the rating because XOR is in the
    set of arithmetic/logic instructions.
  • Group Results by Functions: This is just an alternative display method,
    giving a better overview on how many suspicious blocks are contained in
    the same functions.
Here is a use case for this widget: When I am trying to identify cryptography in malware samples, I often have problems finding compact but frequently used crypto algorithms such as RC4 that usually do not carry constants with them (which would allow to spot them by simple signature matching).
In the above screenshot (from a current Citadel sample with 724 functions) you can see that the candidate blocks have been reduced to 23 out of 9526 basic blocks. The filters are set to show only blocks with a rating of above 30%, with a size of 10 or more instructions and 1 or 0 call instructions. 23 blocks is a number small enough for me to look at in just a few minutes, identifying the relevant parts in a very short amount of time.

Among the 23 blocks is the following one:
Citadel's modified stream cipher.
containing the modified stream cipher that is used in Citadel. In addition to the normal XOR/substitutions, Citadel also XORs against the characters of a static hash contained in the binary, which is considered one of the "advancements" from its predecessor Zeus 2.
While this may be a weak example because the block is easily identified by searching for exactly this hash, you probably get the idea on how to use the widget.
The heuristic also successfully identifies all the other crypto parts in the sample like the AES and CRC32 algorithms.

If you wonder about how you get double-sliders in Qt (because it is not a standard widget): The idea and code of this widget called "BoundsEditor" is adapted from Enthought's TraitsUI, which luckily is open-source software. I took the code and reduced it back to a standard Qt widget, having a great and compact control element to adjust my parameters.

Signature-based crypto identification

The second part of the widget does what you might have expected in the first place. It simply uses a set of constants in order to find well-known cryptographic algorithms. It's basically inspired by tools like the IDA findcrypt plugin or the KANAL plugin for PEiD. It does the same job, except being directly coupled to IDA and allowing to instantly jump to the code locations referencing the identified constants.
The following screenshot (from an old but gold conficker sample) shows both types of matches:

  • [black] referenced by: constant somewhere (e.g. data section), referenced by code.
  • [red] referenced by: constant immediately used in code, just as shown in the basic block to the left.
The currently supported algorithms are (with ingredients from Ilfak Guilfanov's findcrypt, Felix Gröbert's kerckhoff's, a crypto detection implementation by Felix Matenaar from his Bachelor thesis, and some of my own adaptions):
  • ADLER 32
  • AES
  • Blowfish
  • Camellia
  • CAST256
  • CAST
  • CRC32
  • DES
  • GOST
  • HAVAL
  • IDEA
  • MARS
  • MD2, MD5, MD6
  • MD5MAC
  • PKCS (various initialization values)
  • RawDES
  • RC2, RC5
  • Rijndael
  • Ripe-MD160
  • SAFER
  • SHA224
  • SHA256
  • SHA384
  • SHA512
  • SHARK
  • SKIPJACK
  • SQUARE
  • Serpent
  • Square/SHARK
  • TIGER
  • Twofish
  • WAKE
  • Whirlpool
  • Zlib
The only thing missing right now is renaming / tagging those functions based on the signatures, maybe I will implement that, too.

Other changes to IDAscope

To conclude this post, I want to briefly discuss some more changes I did to IDAscope since the last post.
  • In my last post, I mentioned that the WinAPI widget only worked against the
    offline data from the Windows SDK. This is no longer the case, as it now
    supports doing online lookups (controllable by a checkbox) in the case it
    does not find local information. This is great because by that, the missing
    documentation of CRT and NTDLL functions are now also covered. Parsing
    of the MSDN webpage can be optimized but works for now.
  • Hotkey support for widgets. As an example, [CTRL+Y] will now look up the
    currently highlighted identifier (in IDA View) in the WinAPI widget and
    change focus to this widget.
  • More changes under the hood, data structures, refactoring, etc. I feel that
    the code is better organized and easier to understand now.
  • Experimental code for visualizing the function relationship starting by
    Thread start addresses (cmp. Alex' last blog post).
Next to come is the integration of Alex' latest scripts into widgets.

Wednesday, July 25, 2012

IDAscope update: WinAPI browsing

A week has passed since my last blog post, so it's time to give an update on the current status of development for IDAscope. The title mentions WinAPI browsing, which I am introducing later in the post. First I want to give a follow up on the need for data flow analysis I explained in the last post.

IDAscope + Data flow analysis?

In my last post, I mentioned that one of the next steps would be data flow analysis of parameters to get a better interpretation of API calls. While I am still pursuing this, I realized that it will come not in as easy as I hoped. At least when I want to do it properly. While having studied CS and not having tried to circumvent lectures on theory, I went back to basics and started reading on data flow analysis. Soon, I realized that I have rusted already a little bit, doing more practical work than I probably should have (at least for being in an academic environment). However, the first two chapters were pretty illuminating and helped me to grasp the message of Rolf Rolles' keynote at REcon better.
I took the following lessons from my peek into this book:
  • There are well-defined, nice mathematical frameworks to perform data flow analysis.
    Efficient algorithms are available in pseudo code, so most of the work has been done already.
  • Intraprocedural data flow analysis is enough for what we need here.
    Having Def/Use-chains would be great.
  • Implementing this generically will take a lot of time. ;)
So for now I feel that it has more value to implement other functionality/ideas for easing the reverse engineering workflow first than putting together a full data flow framework. I still have this on the agenda but I will probably come up with a very simplified version (say: hack) that will at least show reference in a way IDA does it already (incl. clickable reference):

Possible substitution for full data flow analysis.
However, I still see the potential of data flow analysis and will pick this up later on, I guess.
If you have a hint on how to integrate data flow analysis at this point without introducing much external dependencies, let me know.

IDAscope: WinAPI browsing

Reading my last blog again, it turns out the "long-term targeted functionality to have MSDN browsing embedded in IDAscope" was a lot easier to do than initially assumed.

The starting point to this was given to me by Alex. As you might know, there comes a very handy information database along with a Windows SDK installation. In its program files folder, there is a subfolder "help/<version number>", containing roundabout 250 *.hxs files, which are basically "Microsoft Help Compiled Storage" files. Treating them with 7zip results in about 130.000 files, consuming 1.4 GB space. Most of them are simple HTML files, probably similar to the MSDN available online.
What is great about those files, is the indexing/keyword scheme used by Microsoft, explained here and here.
Just to show you what I am talking about, example "createfile.htm":
[...]
<MSHelp:Keyword Index="F" Term="CreateFile"/>
<MSHelp:Keyword Index="F" Term="CreateFileA"/>
<MSHelp:Keyword Index="F" Term="CreateFileW"/>
<MSHelp:Keyword Index="F" Term="0"/>
<MSHelp:Keyword Index="F" Term="FILE_SHARE_DELETE"/>
<MSHelp:Keyword Index="F" Term="FILE_SHARE_READ"/>
<MSHelp:Keyword Index="F" Term="FILE_SHARE_WRITE"/>
<MSHelp:Keyword Index="F" Term="CREATE_ALWAYS"/>
[...]

Parsing this information was trivial, leaving us with a dictionary of 110.000 keywords (API names, structures, symbolic constants, parameter names, ...) pointing to the corresponding files.

Now we just need a way to visualize the data/html. I decided to use QtGui's QTextBrowser instead of QWebView, which would have been basically full WebKit. Mainly because it requires a full installation of Qt instead of only PySide as shipped with IDA Pro. Furthermore, QTextBrowser fully suffices our needs as it is able to render basic HTML of which the Windows SDK API documentation is comprised anyway.

The result looks like this:

WinAPI browsing via IDAscope.


The links you see in the picture there are all functional, which is really nice to get some context around the API you are currently reading about. And because of course we want to be hip, I used QCompleter to give search suggestions based on the keywords:

Clicking on the API names in the first picture shown above in the data flow section will also bring up the respective API page, changing window focus to the browser.
As possible future features for this, I think of extending the context menu (right click) of the IDA View by a "search in WinAPI" in order to ease use and also cover names that are not targeted by the set of semantic definitions. From my own usage experience, having a "back" button in the browser will also be essential, so I will add that soon, too.

A downside of using Windows SDK as exclusive data source is that information about ntdll and CRT functions is not included. Maybe I will add a switch for "online" mode, so you can still surf MSDN from within the window. But this has lower priority right now.

So not much technical stuff in today's post but I am positive that we can change that in the next one. I hope I have implemented the data flow "hack" by then. But the next main goal is to bring the subroutine exploration explained by Alex in his blog post into IDAscope. Based on the structural information generated through his scripts, I feel that there is more to gain from.

Wednesday, July 18, 2012

Introducing: IDAscope

About a week ago, I already announced on Twitter the progress for the IDA plugin called "IDAscope" Alex and I are currently working on, showing a screenshot. In this post, I want to roll out some basic thoughts on the idea behind the plugin and its motivation.

I feel that there is still a lot of potential for visually exploring the data contained in a binary being subject to analysis. And be it just by providing certain overviews that are not available by the stock versions of our analysis tools.
About a year ago, I started off with a little script that tagged unexplored (i.e. not renamed) functions with a short semantic description on what I assume is happening inside based on API calls. If there are calls to, let's say ws2_32!connect, ws2_32!send, ws2_32!receive there would be an extension of "net" to the default name "sub_c0ffee", yielding the name "net_sub_c0ffee". However, sorting by function names with the standard Funtion Window of IDA is unsatisfactory, as sorting by tags is just not possible. That brought up that I would need some kind of custom table visualization, like the one you might have already seen in my tweet. Here is the screenshot, so you don't have to click anything:
Introducing IDAscope
Introducing IDAscope.

I read a MindShaRE blog post by Aaron Portnoy on his journey with IDA/PySide and it was some kind of a door opener for me, as it showed me what would actually be possible by building own GUI extensions. By that time, I started working on the plugin but was thrown back when Aaron and Brandon announced Toolbag, which already in the Beta seemed to be a powerful implementation extending IDA with a lot of features that come in handy.
REcon set me back on track and now I am motivated again to pursue my plugin as I noticed that the focus of my plugin is different from theirs. The feedback of Alex also put in a lot of motivation, helping me to continue.

So after the REstart, the next step was to take the basic existing script as mentioned before and embedding it in some optimized graphic front end, resulting in the GUI as shown here:

Current state of "Function Inspection".

Having an overview of the tagged functions was just one step, having the relevant API calls responsible for the tag was a logical consequence. Right now, I am working on extracting the parameters to these function calls. For this, some basic data flow analysis is needed of course.

To support my point, I want to introduce you to my favorite malware sample: 92a1ad5bb921d59d5537aa45a2bde798. This is a very simple Spybot variant with timestamp of 2003, which I believe to be its true date. It's one of my standard samples used to teach RE at university. The sample is a good read and nice to study if you are new to malware analysis. Funny sidenote: it is only detected by 37/42 AVs on VirusTotal, despite having no protection, obfuscation, whatsoever.

From the 231 API calls tagged by IDAscope, the parameters to these API calls have pushes of the following type:
  • General Register -> 287
  • Immediate Value -> 263
  • Memory Reg [Base Reg + Index Reg + Displacement] -> 83
  • Direct Memory Reference to Data -> 21

This means that 60% of the parameters can be potentially resolved via data flow analysis, providing a more interesting value than "eax" or "[0x405004]" as it is in the current state of development. While this is only one example, I am confident that putting the effort into data flow analysis is worth it as it opens doors to other interesting use cases.

But even for the immediates there are more possibilities. Many of them can be further resolved as shown in the following example.
Think of:
push 0
push 1
push 2
call socket
a typical constellation as shown to you by IDA Pro.

By knowing the type of the parameter and the immediate value, we can directly resolve those to:
push IPPROTO_IP
push SOCK_STREAM
push AF_INET
call socket
which nets us the information that it is a TCP connection based on IP. While these are probably values you know by heart anyway, there is still a lot of moments where I find myself looking into MSDN in order to figure out what exactly is happening with this or that API call.
Long-term, I want to have some functionality for looking up APIs, structs and types via MSDN directly integrated into the plugin. I know that there are scripts by others that do this already, but often combination of features leads to emergence.

Another feature that is already integrated and that was shown in the tweet was the coloring of basic blocks based on the semantic type of the tag. Once you are used to the colors, this can really speed up navigation in a function using the Graph overview.

For my config, I use the following six colors:
  • yellow for memory manipulation
  • orange for file manipulation
  • red for registry manipulation
  • violet for execution manipulation
  • blue for network operations
  • green for cryptography

Right now, the highlighting is implemented in a 3-way cycle: use 6 colors, use standard color (all red), disable. Disabling is important because I noticed that you can also get to a point where you focus too hard on the colors and might miss other important spots.

We will not commit to any kind of release date as there is still a lot of ideas that might find their way into the first, official release. However, if you are interested or want to share ideas for features, let us know and we will see what we can do.

Alex will probably blog in the next days about another aspect of functionality that will find its way into the plugin, introducing a second tab.

Stay tuned for more news on IDAscope. :)

Tuesday, July 10, 2012

PNX.TF now with blog

I decided to start this blog as a test-balloon in order to complement my recently launched site pnx.tf.
There are multiple reasons for this.

First, I feel that it will help me to publish content easier, which is something I had in mind for some time already. Each blog entry is defined by its publishing time as well as optional tags, which allows for at least two comfortable ways of exploring it.
Furthermore, a notification on updates in form of feeds comes for free with the provided infrastructure, which is really handy. You readers can directly comment on the posts, too, another plus.

I didn't have any plans on integrating all that functionality into pnx.tf because I like my main website static. But as an addition, I think it's the right decision. This means that I will keep the main site reduced to some kind of documentary file vault, a showcase of my work. It will provide the space for references I might want to include here.

That's for the introduction, I hope that I can follow up with actual content soon.

Alex already blogged on a project that I put some effort in some time ago and published a really nice script in Python for IDA that allows automatic renaming of functions containing certain API calls.
Over he last week, I picked up development speed for the GUI-driven version Alex mentioned. It contains some bonus features, so if you like the renaming script, chances are good you will like my plugin, too.